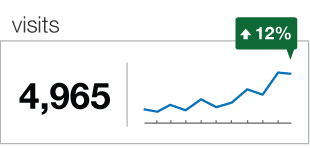
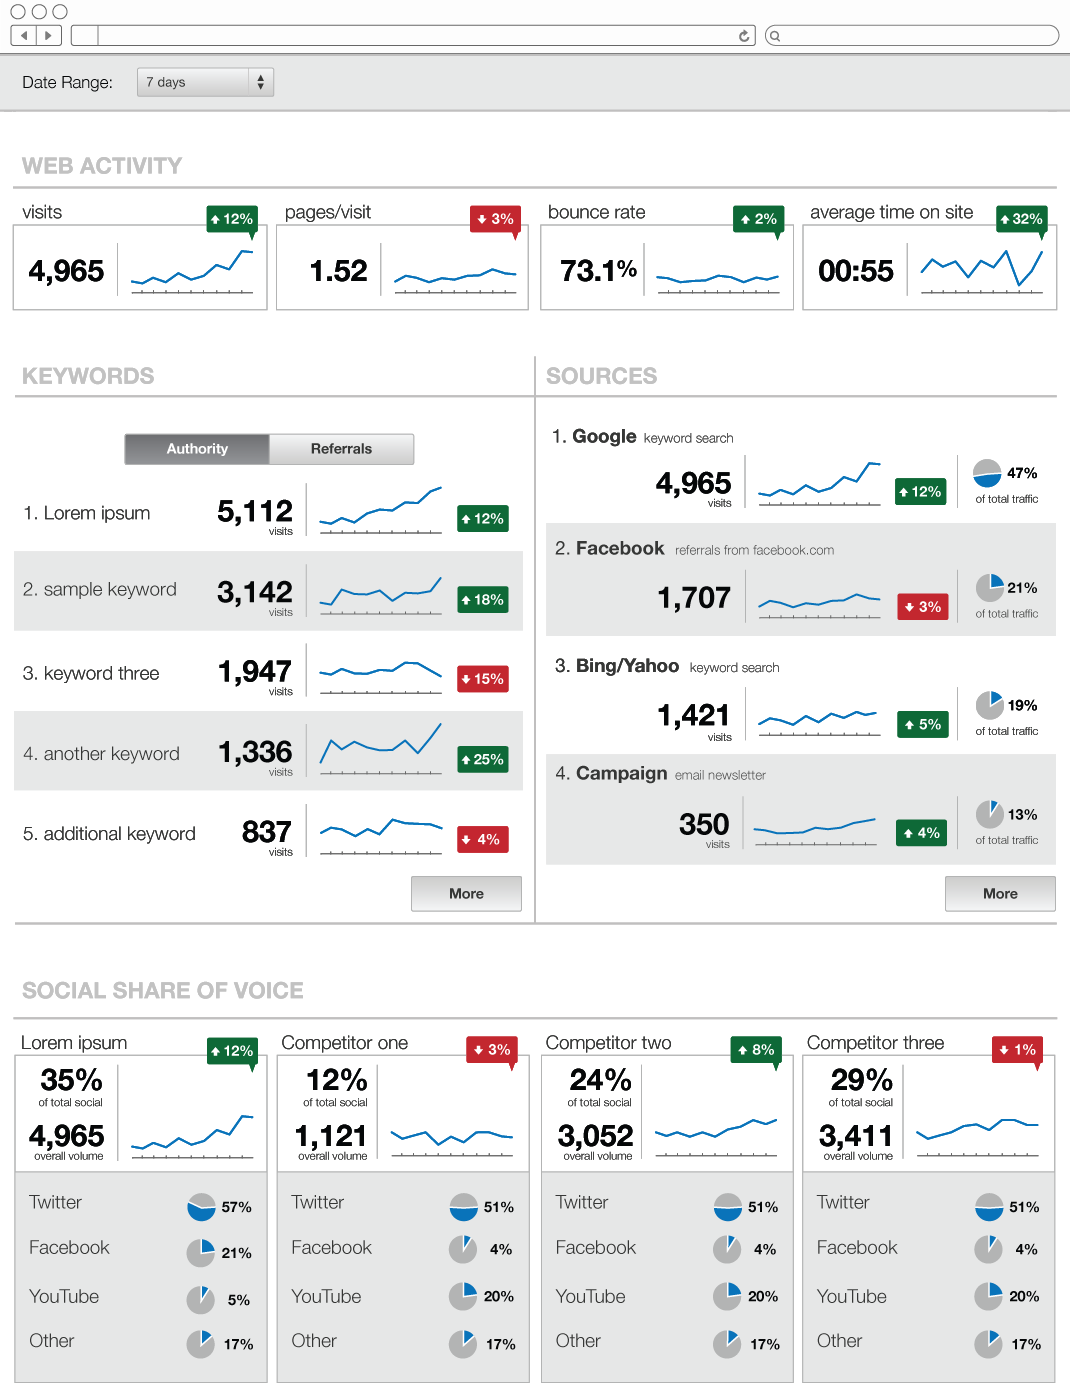
A data visualization showing website activity – there are 4,965 current total visitors to the website, up 12% since the previous period, continuing the trend from the last few periods.
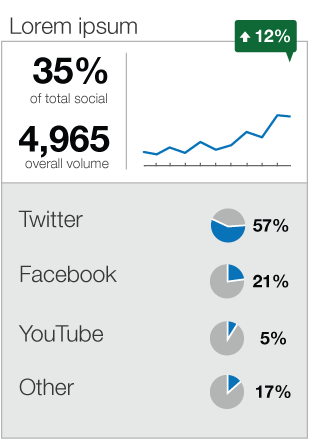
A data visualization showing Share of Voice in key social media channels over a given time period. This grouped display of data is used for side-by-side comparisons with key competitors.
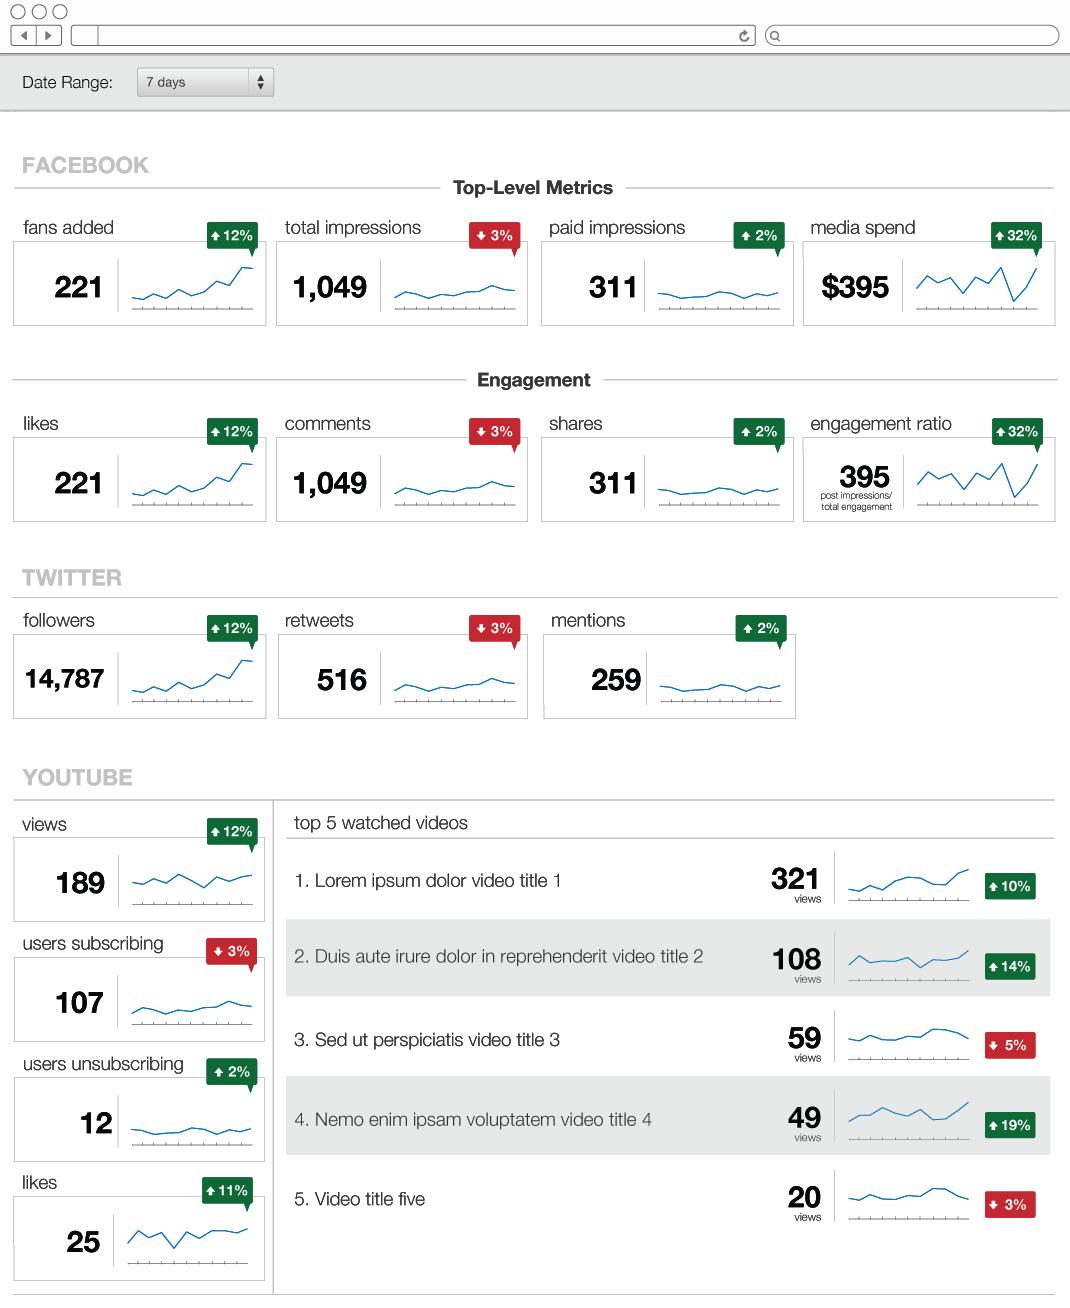
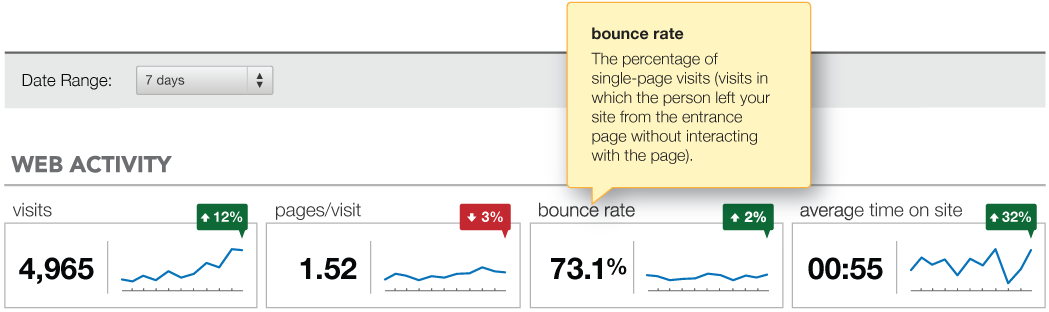
Tooltip functionality
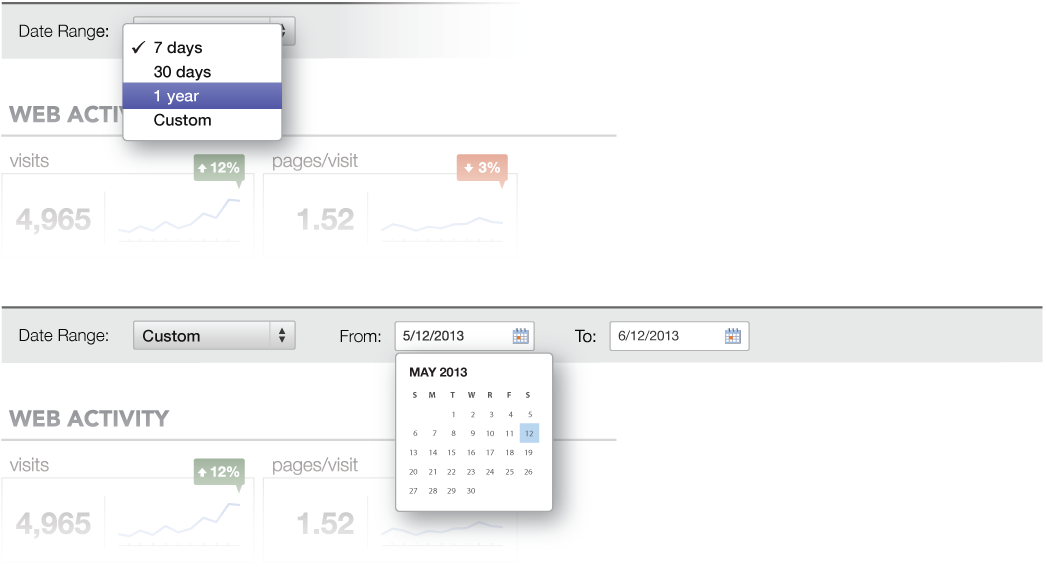
Date range selection